
Two sides to every story?
Doug Drabik discusses fixed income market conditions and offers insight for bond investors.
The market has been indecisive but with reason. 2023 has been filled with strong opinions however, many of the opinions are of contrasting beliefs. Reading the future is not easy. If it were then getting wealthy would be equally simple. We constantly attempt to position our investments to optimize return. What is becoming more difficult to navigate (in my opinion) is how the media’s influences on our market views. Why? At the risk of sounding cynical, it is problematic to try to determine if what we are hearing is a reporting of facts or a twisting of partial truths with added sensationalism to sell tickets to the show.
As we close out 2023, the market tone has shifted to strongly suggest that all is well and the economy will avoid any of the negative trappings owed to the massive money injected into the economy, inflation, the pandemic, elevated interest rates, or any geopolitical occurrences plaguing the world. As a strategist for fixed income, part of my role is to demonstrate ways to protect your hard-earned wealth and, although growth is a welcome secondary benefit, guarding your capital is often the primary goal. When the whole world seems to come together on an opinion, I tend to take a cautious look and at the very least, expose the other side or reasonable alternative economic paths that may influence your fixed income choices.
We do not have to go back in time very far to expose the dangers of erroneous mantras. Recall the Fed’s proclamation that inflation was merely transitional. Instead, we saw inflation climb to 9.1% (Consumer Price Index year-over-year) at a high and average 8.0% in 2022. This year inflation has dropped significantly to 3.1%, directionally constructive, yet still a distance from the Fed’s 2.0% goal. Remember also that inflation reduction does not mean price reduction. It simply means that prices are growing at 3.1% instead of 9.1%. The detrimental effects of higher prices instituted last year remain. Food and services cost more today than they did a couple of years ago. The hope is that eventually, earnings increase to absorb the cost. Earnings are not keeping pace so far.
At the same time that borrowing costs have risen, consumers are borrowing more. The free government handouts and backstop programs have ended. Credit card debt is rising to alarming numbers.
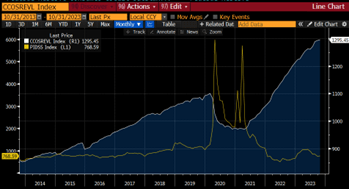
The blue-shaded area depicts the growing consumer credit card debt. During the pandemic, it naturally dipped as businesses were closed and services were suspended. The yellow line represents personal savings. The deviation between the two is troubling. Consumers are responsible for roughly 70% of our economy. Their inability to contribute or spend will likely have an impactful consequence.
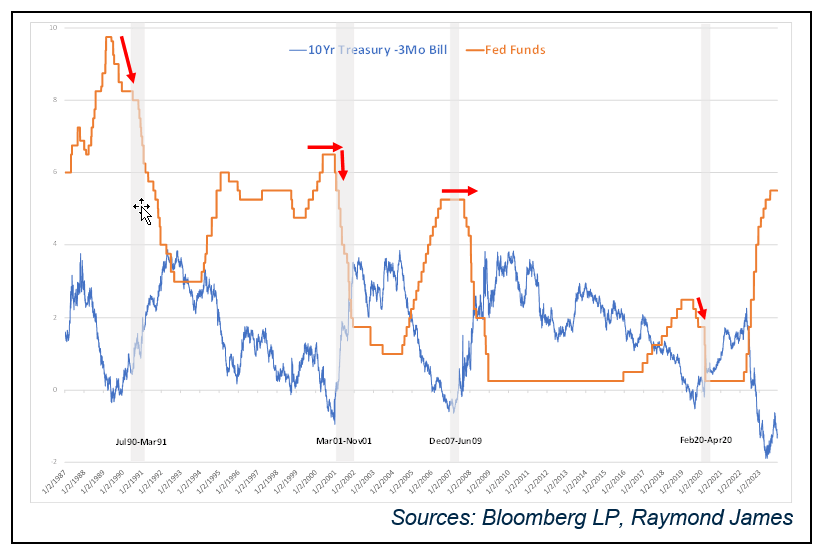
This graph depicts the Fed Funds upper bound rate (orange line) and the difference between the 10-year Treasury and 3-month Bill (blue line). Each time the blue line dips below “0”, the curve is inverted. An inverted curve indicates that short-term rates are higher than long-term rates. The market believes that future rates are headed down.
The yield curve has been noted as one of the better predictive indicators for an upcoming recession. When you look at the range of data (not try to pinpoint an outlier small range), inverted curves are typically followed by recessions. These recessions also tend to follow once the Fed has peaked its interest rate hike cycle or after they have reversed policy and have already begun to loosen/cut rates. Has the Fed finished its tightening policy (hiking rates) or if inflation remains sticky is it possible they could still hike another 25 basis points? The overwhelming market reaction indicates they are done.
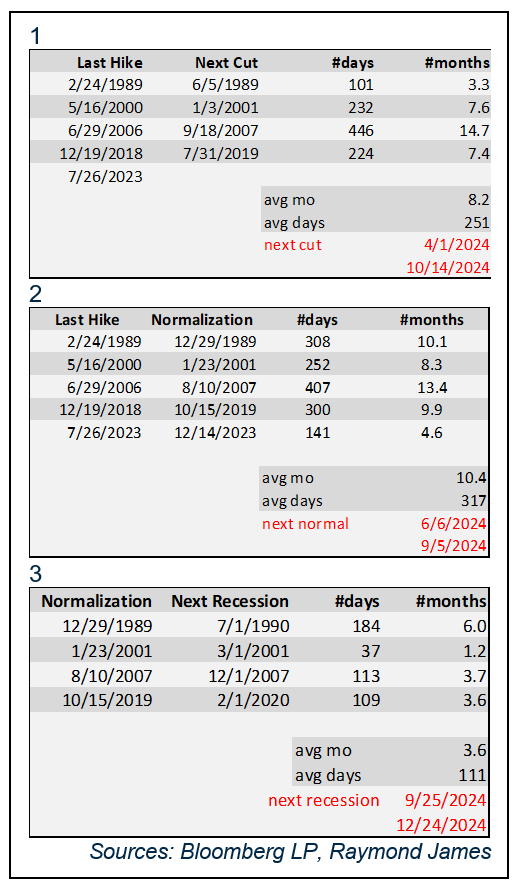
Here are some additional interesting averages that attempt to put timelines into perspective. The first chart looks at the timeline between the last Fed hike in a cycle to the first cut they make in the next cycle. On average, there is an 8.2 month span. Since this is the longest and deepest inversion in modern history, it is logical to also look at the longer delay in action. If looking solely at these averages, it puts the first Fed cut sometime between April and October of next year. Given the deep and extended curve inversion as well as the slow but steadily declining consumer debt status, we believe that there is a higher likelihood the scenarios play out closer to the later part of the ranges for all 3 boxes.
Box 2 looks at the last hike and how long it historically has taken for the Treasury curve to normalize (become upward-sloping). Viewing it in the same manner, it would indicate that the curve may normalize between June and September of next year.
Finally, box 3 looks at the period it has historically taken between the Treasury curve normalizing and the next recession. If averages play out, it indicates that a recession may occur in the 4th quarter of 2024.
Of course, none of the above may occur or occur on the said timeline. These figures are meant to give us historical context on what has happened and compare it to what is happening. One conclusion I draw is that we have gotten way ahead of ourselves on predictions and market reactions. These cycles take a long time to play out.
Recently I had the pleasure of conducting an economic outlook session with the President of Fixed Income Horace Carter. To paraphrase one of his comments, “…with all of the stimulus and backstop programs injected into the economy… for the Fed to be able to orchestrate a soft landing would be comparable to trying to land a 747 on your driveway…”.
Although I concur with Horace’s take, the market chant suggests the opposite. There is mounting data to back our view, so we just want you to be careful in concluding too soon. The good news is that yields have remained elevated.
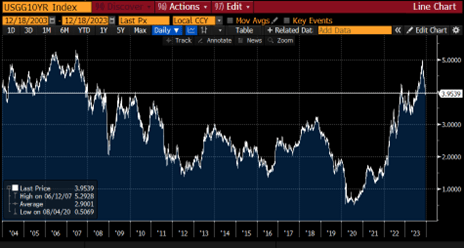
The 10-year Treasury graph illustrates that even with our recent rate retraction, the general level of rates remains higher than we’ve consistently seen in over 15 years. It remains an income-favorable moment in time to add fixed income or solidify fixed income allocations in the investment portfolio. When we see a pullback in rates, it is common for investors to experience anchoring bias. That is, we get fixated on the peak and the thought that we will go back to peak rates. Fight the anchoring bias. Fixed income is a long-term strategy and when you step back and look at the reality and relevance of rates, we still have time to capitalize on the obtainable income benefits.
The author of this material is a Trader in the Fixed Income Department of Raymond James & Associates (RJA), and is not an Analyst. Any opinions expressed may differ from opinions expressed by other departments of RJA, including our Equity Research Department, and are subject to change without notice. The data and information contained herein was obtained from sources considered to be reliable, but RJA does not guarantee its accuracy and/or completeness. Neither the information nor any opinions expressed constitute a solicitation for the purchase or sale of any security referred to herein. This material may include analysis of sectors, securities and/or derivatives that RJA may have positions, long or short, held proprietarily. RJA or its affiliates may execute transactions which may not be consistent with the report’s conclusions. RJA may also have performed investment banking services for the issuers of such securities. Investors should discuss the risks inherent in bonds with their Raymond James Financial Advisor. Risks include, but are not limited to, changes in interest rates, liquidity, credit quality, volatility, and duration. Past performance is no assurance of future results.
Investment products are: not deposits, not FDIC/NCUA insured, not insured by any government agency, not bank guaranteed, subject to risk and may lose value.
To learn more about the risks and rewards of investing in fixed income, access the Financial Industry Regulatory Authority’s website at finra.org/investors/learn-to-invest/types-investments/bonds and the Municipal Securities Rulemaking Board’s (MSRB) Electronic Municipal Market Access System (EMMA) at emma.msrb.org.