
The many lives of the U.S. consumer
Chief Economist Eugenio J. Alemán discusses current economic conditions.
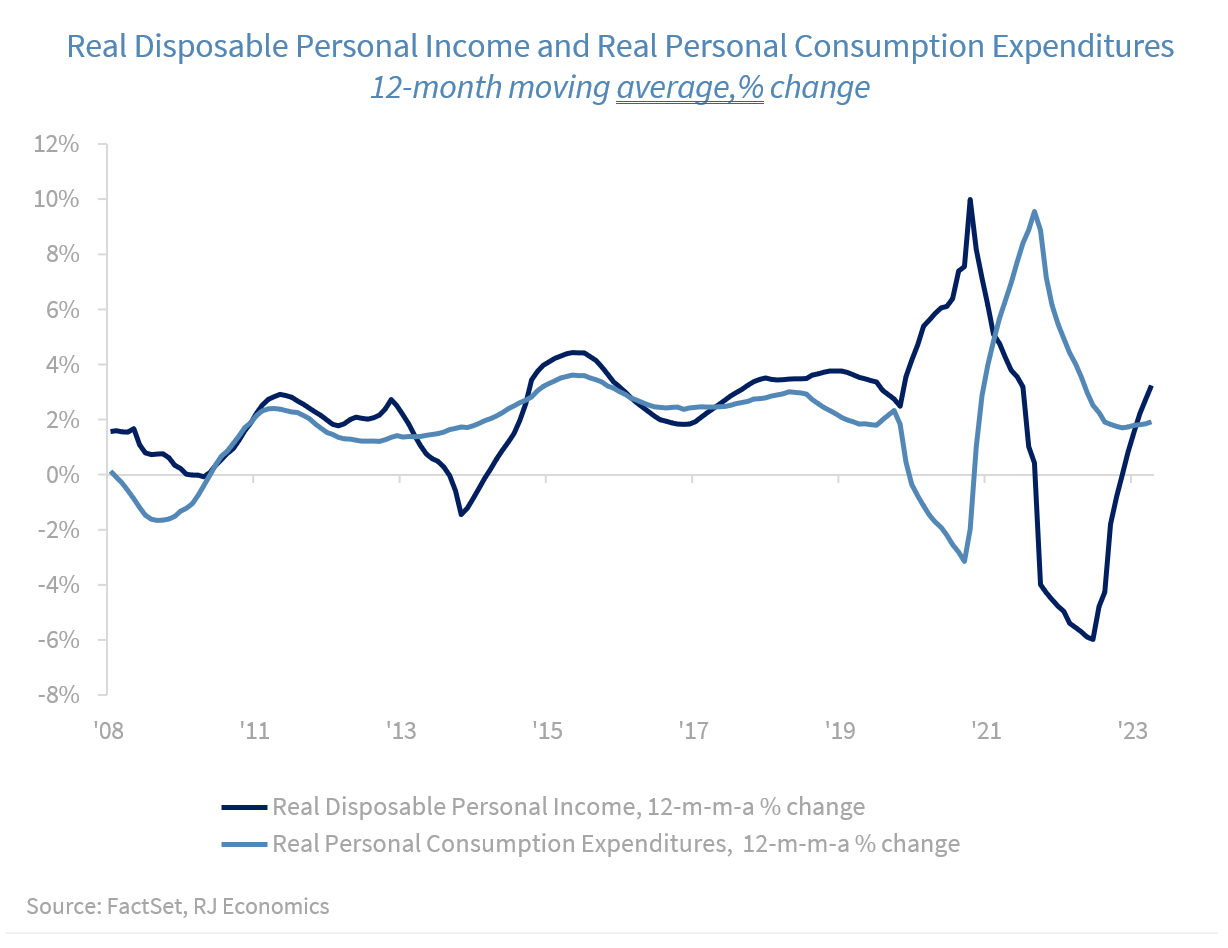
To argue that the U.S. consumer has remained resilient has become a cliché and at the same time an understatement. After a very strong increase in real incomes during the pandemic, real income growth started to slow considerably. The first slowdown occurred when the federal government ended its income transfer campaign at the end of the pandemic recession. The second one started in 2021 as inflation started to bite hard and the purchasing power of income declined accordingly. However, lately, while the growth in real consumption expenditures has normalized and stabilized at around 2.0% per year at a 12-month- moving average rate, real disposable personal incomes have started to move higher as inflation’s bite has subsided and employment growth has remained relatively strong. Real disposable personal incomes are growing at about a 3.2% rate on a 12-month moving average versus a rate of slightly below 2.0% for real personal consumption expenditures.
The strength of the U.S. economy was reflected once again during Wednesday’s release of the ISM Services PMI, which showed a relatively strong service economy, as the Index remained in expansion territory for an eleventh consecutive month and showed an improvement compared to October of this year. The slightly negative reading from the ISM Services PMI was on the side of inventories, which could indicate trouble ahead if the holiday season is not as strong as firms in the service sector expect.
November employment and the Fed: The devil is the details
November’s employment numbers were very positive for the U.S. economy and a mixed bag for the Federal Reserve (Fed) as it remains clear that today’s high interest rates have done little to convince U.S. firms to slow down the hiring process. Having said this, the devil is in the details: only three sectors of the economy added workers at a fast pace, the health care and social assistance sector, the leisure and hospitality sector, and the government sector.
Two of those sectors were in the service side of the economy while the other one was local and state governments. The increase in local and state government workers continues to reflect the fact that these governments were probably ‘priced-out’ of hiring during the strong recovery from the pandemic and are now taking advantage of an increased supply of workers while at the same time they are probably still awash in cash from the transfers received during the pandemic. Meanwhile, the health care and social assistance sector is a sector that typically does well during good as well as bad economic times while the leisure and hospitality sector continues to recover from the pandemic. However, the overall performance of employment was not as strong as these three sectors indicate, so, for the U.S. economy, the news is positive. For the Fed, the mixed report supports its stance regarding monetary policy: staying put next week after the Federal Open Market Committee (FOMC) meeting.
This means that the Summary of Economic Projections, or SEP, as well as the dot plot will have added importance for markets. However, don’t expect it to give much certainty going forward.
Changes to our economic forecast
We have made small changes to our economic forecast to include more up to date information on the potential path of the U.S. economy. As such, we have moved our recession call to start during the second quarter of the year instead of the first quarter of the year and to last for two consecutive quarters. Furthermore, we have changed our forecast for the whole of 2024 from a growth rate of 0.8% to a growth rate of 1.0%, which means that we now believe that the U.S. economic recession will be even milder than what we had expected several quarters ago.
The changes are predicated on the better than expected job numbers, higher real disposable personal income growth and the Bureau of Economic Analysis’ revised saving rate. These factors caused us revise our estimate of excess savings accumulated during the COVID pandemic recession.
At the same time, the lingering effects of the three acts signed into law by the Biden administration, the IRA, the CHIPS, and the Infrastructure, have continued to provide impetus to non-residential investment and have prevented overall investment spending from reacting to higher interest rates even as residential investment has corrected considerably over the last year and a half.
Economic and market conditions are subject to change.
Opinions are those of Investment Strategy and not necessarily those of Raymond James and are subject to change without notice. The information has been obtained from sources considered to be reliable, but we do not guarantee that the foregoing material is accurate or complete. There is no assurance any of the trends mentioned will continue or forecasts will occur. Last performance may not be indicative of future results.
Consumer Price Index is a measure of inflation compiled by the US Bureau of Labor Statistics. Currencies investing is generally considered speculative because of the significant potential for investment loss. Their markets are likely to be volatile and there may be sharp price fluctuations even during periods when prices overall are rising.
Consumer Sentiment is a consumer confidence index published monthly by the University of Michigan. The index is normalized to have a value of 100 in the first quarter of 1966. Each month at least 500 telephone interviews are conducted of a contiguous United States sample.
Personal Consumption Expenditures Price Index (PCE): The PCE is a measure of the prices that people living in the United States, or those buying on their behalf, pay for goods and services. The change in the PCE price index is known for capturing inflation (or deflation) across a wide range of consumer expenses and reflecting changes in consumer behavior.
The Consumer Confidence Index (CCI) is a survey, administered by The Conference Board, that measures how optimistic or pessimistic consumers are regarding their expected financial situation. A value above 100 signals a boost in the consumers’ confidence towards the future economic situation, as a consequence of which they are less prone to save, and more inclined to consume. The opposite applies to values under 100.
Certified Financial Planner Board of Standards Inc. owns the certification marks CFP®, CERTIFIED FINANCIAL PLANNER™, CFP® (with plaque design) and CFP® (with flame design) in the U.S., which it awards to individuals who successfully complete CFP Board's initial and ongoing certification requirements.
Links are being provided for information purposes only. Raymond James is not affiliated with and does not endorse, authorize or sponsor any of the listed websites or their respective sponsors. Raymond James is not responsible for the content of any website or the collection or use of information regarding any website's users and/or members.
GDP Price Index: A measure of inflation in the prices of goods and services produced in the United States. The gross domestic product price index includes the prices of U.S. goods and services exported to other countries. The prices that Americans pay for imports aren't part of this index.
The Conference Board Leading Economic Index: Intended to forecast future economic activity, it is calculated from the values of ten key variables.
The Conference Board Coincident Economic Index: An index published by the Conference Board that provides a broad-based measurement of current economic conditions.
The Conference Board lagging Economic Index: an index published monthly by the Conference Board, used to confirm and assess the direction of the economy's movements over recent months.
The U.S. Dollar Index is an index of the value of the United States dollar relative to a basket of foreign currencies, often referred to as a basket of U.S. trade partners' currencies. The Index goes up when the U.S. dollar gains "strength" when compared to other currencies.
The FHFA House Price Index (FHFA HPI®) is a comprehensive collection of public, freely available house price indexes that measure changes in single-family home values based on data from all 50 states and over 400 American cities that extend back to the mid-1970s.
Import Price Index: The import price index measure price changes in goods or services purchased from abroad by U.S. residents (imports) and sold to foreign buyers (exports). The indexes are updated once a month by the Bureau of Labor Statistics (BLS) International Price Program (IPP).
ISM New Orders Index: ISM New Order Index shows the number of new orders from customers of manufacturing firms reported by survey respondents compared to the previous month. ISM Employment Index: The ISM Manufacturing Employment Index is a component of the Manufacturing Purchasing Managers Index and reflects employment changes from industrial companies.
ISM Inventories Index: The ISM manufacturing index is a composite index that gives equal weighting to new orders, production, employment, supplier deliveries, and inventories.
ISM Production Index: The ISM manufacturing index or PMI measures the change in production levels across the U.S. economy from month to month.
ISM Services PMI Index: The Institute of Supply Management (ISM) Non-Manufacturing Purchasing Managers' Index (PMI) (also known as the ISM Services PMI) report on Business, a composite index is calculated as an indicator of the overall economic condition for the non-manufacturing sector.
Consumer Price Index (CPI) A consumer price index is a price index, the price of a weighted average market basket of consumer goods and services purchased by households. Changes in measured CPI track changes in prices over time.
Producer Price Index: A producer price index (PPI) is a price index that measures the average changes in prices received by domestic producers for their output.
Industrial production: Industrial production is a measure of output of the industrial sector of the economy. The industrial sector includes manufacturing, mining, and utilities. Although these sectors contribute only a small portion of gross domestic product, they are highly sensitive to interest rates and consumer demand.
The NAHB/Wells Fargo Housing Opportunity Index (HOI) for a given area is defined as the share of homes sold in that area that would have been affordable to a family earning the local median income, based on standard mortgage underwriting criteria.
The S&P CoreLogic Case-Shiller U.S. National Home Price NSA Index measures the change in the value of the U.S. residential housing market by tracking the purchase prices of single-family homes.
The S&P CoreLogic Case-Shiller 20-City Composite Home Price NSA Index seeks to measures the value of residential real estate in 20 major U.S. metropolitan.
Source: FactSet, data as of 7/7/2023