
When would it be ok to start cutting rates, and by how much?
Chief Economist Eugenio J. Alemán discusses current economic conditions.
Our forecast for the federal funds rate has the Federal Reserve (Fed) starting to cut rates in July 2024, with a second rate cut before the end of 2024. Markets seem to believe that the Fed is going to start cutting rates earlier than that and expect more cuts than what we currently expect. Whether we are correct, or markets are, will continue to depend on what happens with inflation and how fast it continues to disinflate. If the disinflationary process continues to accelerate, as we have seen lately, markets may have an edge on the future path of interest rates. However, our belief is that the Fed is more concerned about a potential re-acceleration of inflation, especially if the U.S. economy is able to avoid a recession, and it will be very careful in moving rates lower. The Fed’s thought could be the following: If the economy can handle a 5.5% federal funds rate and still grow unabated, why should it ease? But even if the economy goes into a mild recession, as we are still expecting, the Fed is going to be reluctant to move interest rates much lower fearing that lower interest rates could push inflation higher again.
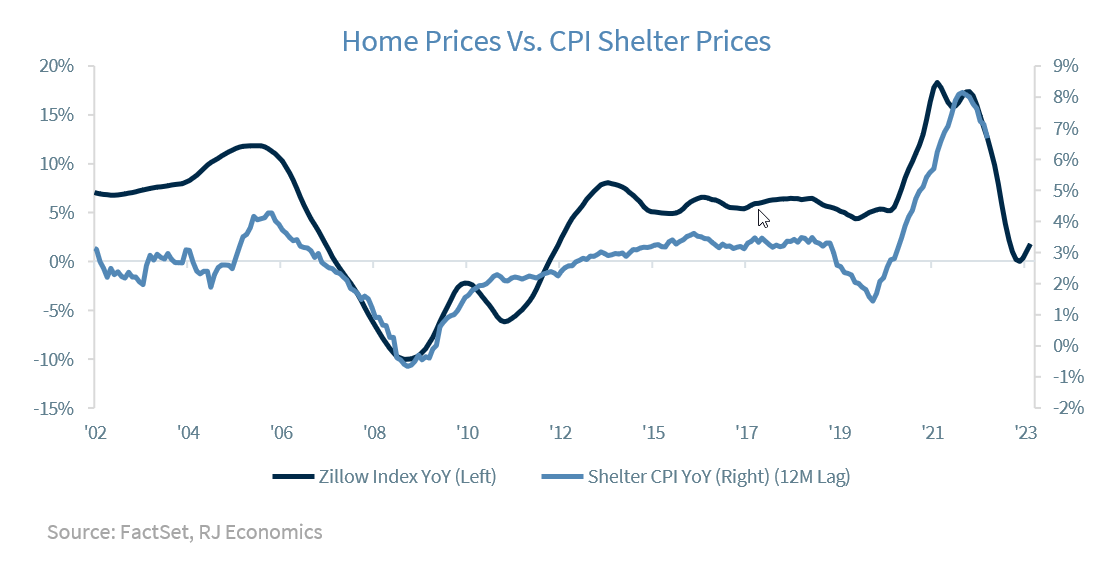
That is, if the Fed starts lowering interest rates, the credit cycle is going to start again with an increase in lending, and then potentially generate higher economic growth on top of an economy that is already growing above potential. If we, on top of this, add continued geopolitical uncertainty or a successful effort by the OPEC+ cartel to push oil prices much higher, then it is very difficult to see Fed officials accepting stronger economic growth with the potential for a re-acceleration of inflation, especially considering that home prices are on the rise again and the inflationary effects of today’s increase in home prices are going to start making their rounds next year.
This means that the Fed is going to be in a bind again, trying to contain markets’ impulses to move ahead and start pricing in even lower rates earlier. On the flip side, if the economy continues to defy current interest rates, then the Fed will have plenty of arguments to keep interest rates high for longer, which is the opposite of what markets are implying today.
The road ahead will remain as uncertain as it has been, and Fed officials will not want to provide more clarity to the markets. Normally, the Fed doesn’t like to go against markets’ bets on what they expect the Fed to do. This means that, if markets assume the Fed has ended this tightening cycle while the Fed wants to keep interest rate high for longer, it needs to convince markets that it is still serious about its commitment and that is not going to be an easy task.
Consumer spending is slowing down but not collapsing
The data on income and spending for October showed a consumer who is slowing purchases but continues to remain engaged in the economy, with no signs that there may be a hard stop any time soon. Furthermore, real disposable personal income is still growing ahead of real personal consumption expenditures, at 3.9% on a year-over- year basis versus a rate of 2.2%, respectively.
This is, perhaps, the fundamental reason why the economy has continued to remain in expansion, as employment and income have continued to support a healthy growth in income. However, the most notable slowdown in October occurred in the month-over-month rate of growth in wages and salaries, printing a rate of only 0.1% during the month after two consecutive prints of 0.5%. And here is where the slowdown in inflation continues to benefit income earners and consumers. That is, the progress in the disinflationary process, while not acknowledged by consumers, is pulling its punches, as real incomes are still moving higher.
Thus, next Friday’s nonfarm employment report will shed some more light on employment growth as it continues to represent the most important line of defense for Americans as well as for the U.S. economy.
Economic and market conditions are subject to change.
Opinions are those of Investment Strategy and not necessarily those of Raymond James and are subject to change without notice. The information has been obtained from sources considered to be reliable, but we do not guarantee that the foregoing material is accurate or complete. There is no assurance any of the trends mentioned will continue or forecasts will occur. Last performance may not be indicative of future results.
Consumer Price Index is a measure of inflation compiled by the US Bureau of Labor Statistics. Currencies investing is generally considered speculative because of the significant potential for investment loss. Their markets are likely to be volatile and there may be sharp price fluctuations even during periods when prices overall are rising.
Consumer Sentiment is a consumer confidence index published monthly by the University of Michigan. The index is normalized to have a value of 100 in the first quarter of 1966. Each month at least 500 telephone interviews are conducted of a contiguous United States sample.
Personal Consumption Expenditures Price Index (PCE): The PCE is a measure of the prices that people living in the United States, or those buying on their behalf, pay for goods and services. The change in the PCE price index is known for capturing inflation (or deflation) across a wide range of consumer expenses and reflecting changes in consumer behavior.
The Consumer Confidence Index (CCI) is a survey, administered by The Conference Board, that measures how optimistic or pessimistic consumers are regarding their expected financial situation. A value above 100 signals a boost in the consumers’ confidence towards the future economic situation, as a consequence of which they are less prone to save, and more inclined to consume. The opposite applies to values under 100.
Certified Financial Planner Board of Standards Inc. owns the certification marks CFP®, CERTIFIED FINANCIAL PLANNER™, CFP® (with plaque design) and CFP® (with flame design) in the U.S., which it awards to individuals who successfully complete CFP Board's initial and ongoing certification requirements.
Links are being provided for information purposes only. Raymond James is not affiliated with and does not endorse, authorize or sponsor any of the listed websites or their respective sponsors. Raymond James is not responsible for the content of any website or the collection or use of information regarding any website's users and/or members.
GDP Price Index: A measure of inflation in the prices of goods and services produced in the United States. The gross domestic product price index includes the prices of U.S. goods and services exported to other countries. The prices that Americans pay for imports aren't part of this index.
The Conference Board Leading Economic Index: Intended to forecast future economic activity, it is calculated from the values of ten key variables.
The Conference Board Coincident Economic Index: An index published by the Conference Board that provides a broad-based measurement of current economic conditions.
The Conference Board lagging Economic Index: an index published monthly by the Conference Board, used to confirm and assess the direction of the economy's movements over recent months.
The U.S. Dollar Index is an index of the value of the United States dollar relative to a basket of foreign currencies, often referred to as a basket of U.S. trade partners' currencies. The Index goes up when the U.S. dollar gains "strength" when compared to other currencies.
The FHFA House Price Index (FHFA HPI®) is a comprehensive collection of public, freely available house price indexes that measure changes in single-family home values based on data from all 50 states and over 400 American cities that extend back to the mid-1970s.
Import Price Index: The import price index measure price changes in goods or services purchased from abroad by U.S. residents (imports) and sold to foreign buyers (exports). The indexes are updated once a month by the Bureau of Labor Statistics (BLS) International Price Program (IPP).
ISM New Orders Index: ISM New Order Index shows the number of new orders from customers of manufacturing firms reported by survey respondents compared to the previous month. ISM Employment Index: The ISM Manufacturing Employment Index is a component of the Manufacturing Purchasing Managers Index and reflects employment changes from industrial companies.
ISM Inventories Index: The ISM manufacturing index is a composite index that gives equal weighting to new orders, production, employment, supplier deliveries, and inventories.
ISM Production Index: The ISM manufacturing index or PMI measures the change in production levels across the U.S. economy from month to month.
ISM Services PMI Index: The Institute of Supply Management (ISM) Non-Manufacturing Purchasing Managers' Index (PMI) (also known as the ISM Services PMI) report on Business, a composite index is calculated as an indicator of the overall economic condition for the non-manufacturing sector.
Consumer Price Index (CPI) A consumer price index is a price index, the price of a weighted average market basket of consumer goods and services purchased by households. Changes in measured CPI track changes in prices over time.
Producer Price Index: A producer price index (PPI) is a price index that measures the average changes in prices received by domestic producers for their output.
Industrial production: Industrial production is a measure of output of the industrial sector of the economy. The industrial sector includes manufacturing, mining, and utilities. Although these sectors contribute only a small portion of gross domestic product, they are highly sensitive to interest rates and consumer demand.
The NAHB/Wells Fargo Housing Opportunity Index (HOI) for a given area is defined as the share of homes sold in that area that would have been affordable to a family earning the local median income, based on standard mortgage underwriting criteria.
The S&P CoreLogic Case-Shiller U.S. National Home Price NSA Index measures the change in the value of the U.S. residential housing market by tracking the purchase prices of single-family homes.
The S&P CoreLogic Case-Shiller 20-City Composite Home Price NSA Index seeks to measures the value of residential real estate in 20 major U.S. metropolitan.
Source: FactSet, data as of 7/7/2023