
Inflation’s fight seems under control, the markets have the upper hand
Chief Economist Eugenio J. Alemán discusses current economic conditions.
November’s inflation numbers delivered good news for the Federal Reserve (Fed) even though the Consumer Price Index (CPI) was higher than what markets were expecting, with shelter costs surprising to the upside. Meanwhile, the preliminary inflation expectations numbers from the University of Michigan’s Survey of Consumers showed that short, as well as long-term inflationary expectations, came down considerably in December, which will continue to support the Fed’s disinflation campaign.
But the real fight is the Fed fighting market expectations for lower rates as soon as March of 2024. That fight is still in its infancy from what we read in the Summary of Economic Projections, the dot plot, and heard during the press conference by Fed Chair Jerome Powell after the last meeting of the Federal Open Market Committee (FOMC). Markets have started to get ahead of the Fed and have brought down long-term interest rates, with the yield on the 10-year Treasury moving under 4.00% immediately after the December 13, 2023, decision.
Absent from the Fed governor’s discourse during this past press conference was the “higher for longer” or “high for longer” mantra the Fed has been using for the last year or so. That is, the Fed went from being very hawkish to being very dovish in less than a month and, perhaps, has made its forward guidance more difficult as markets have jumped ahead on this dovishness.
The new Fed mantra: Recognizing monetary policy’s ineffectiveness
We understand where Fed officials are coming from because the latest inflation numbers plus inflationary expectations have been highly supportive of the disinflationary environment. Furthermore, the Fed Chairman argued that much of the progress has been achieved not through monetary policy but through a normalization of supply chains as well as the normalization of the U.S. labor market, which has included a normalization of immigration.
They seem to be arguing/confirming that monetary policy was not the reason for the increase in inflation during the last several years so there is no reason to continue with the pretense that interest rates need to remain high for longer.
In some sense, the Fed is correct, because what happened during the pandemic recession was a massive fiscal expansion that transferred large amounts of income to individuals and firms, and we are continuing to flush out those funds out of the system. However, since jobs have remained plentiful, these excess funds have been complemented with income from jobs, which have kept consumers going.
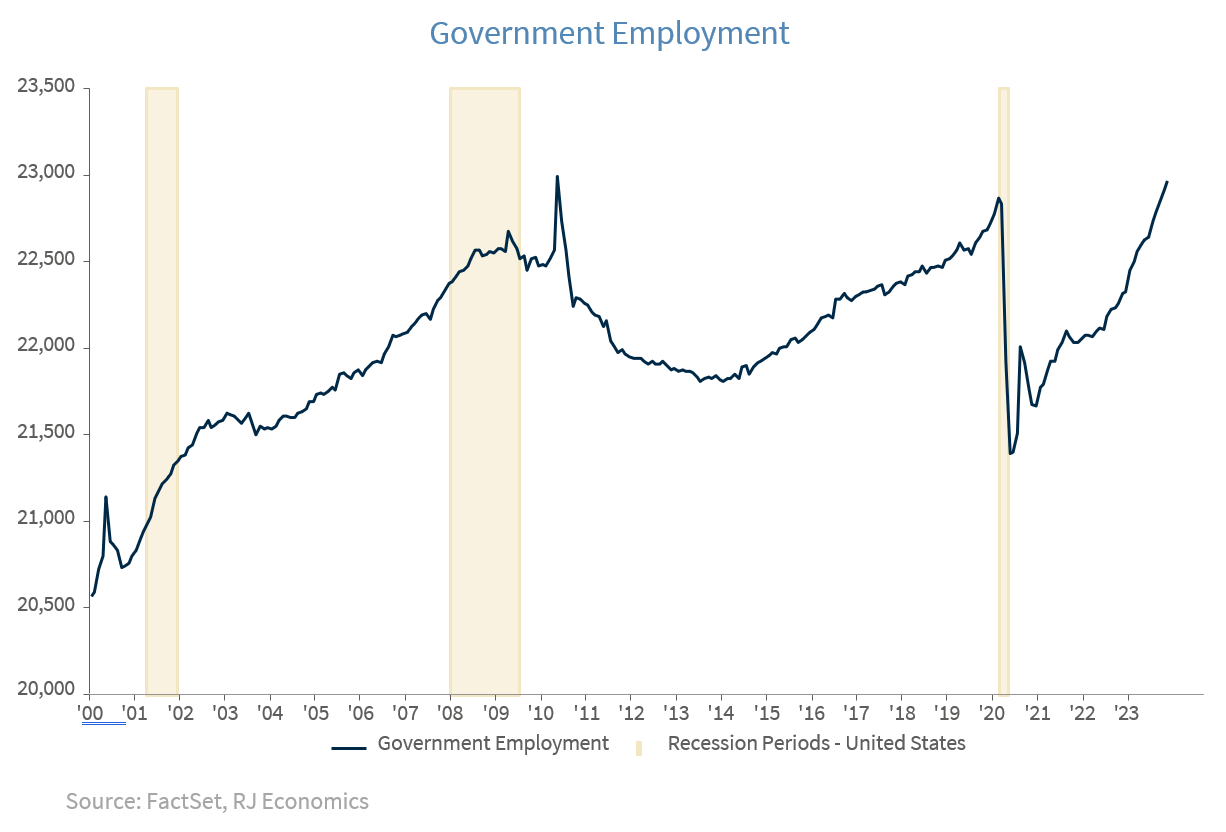
Furthermore, state, and local governments seem to also be awash in cash and continue to hire workers, adding to the strength of employment growth as well as of incomes. At the same time, fiscal and industrial policies and incentives embedded in the CHIPS Act, the Infrastructure Act, and the IRA, have all contributed to help keep nonresidential investment from reacting to higher interest rates and thus have helped keep the U.S. economy from slowing during this year.
Fed: One little, two little, three little cuts – Markets: Four little, five little, six little cuts
Markets know that they have probably called the Fed’s bluff on high for longer and were already pricing in more than two rate cuts in 2024 even before the release of the latest dot plot, which is now indicating that the Fed may go for three 25 basis points (bps) reductions next year for a total of 75 bps. However, once again, markets are starting to second guess the Fed and are pricing in more than three cuts in 2024. This means that if Fed officials want to stick to the 75 bps reduction in rates in 2024, they will have a very difficult time getting the markets to agree with them.
Economic and market conditions are subject to change.
Opinions are those of Investment Strategy and not necessarily those of Raymond James and are subject to change without notice. The information has been obtained from sources considered to be reliable, but we do not guarantee that the foregoing material is accurate or complete. There is no assurance any of the trends mentioned will continue or forecasts will occur. Last performance may not be indicative of future results.
Consumer Price Index is a measure of inflation compiled by the US Bureau of Labor Statistics. Currencies investing is generally considered speculative because of the significant potential for investment loss. Their markets are likely to be volatile and there may be sharp price fluctuations even during periods when prices overall are rising.
Consumer Sentiment is a consumer confidence index published monthly by the University of Michigan. The index is normalized to have a value of 100 in the first quarter of 1966. Each month at least 500 telephone interviews are conducted of a contiguous United States sample.
Personal Consumption Expenditures Price Index (PCE): The PCE is a measure of the prices that people living in the United States, or those buying on their behalf, pay for goods and services. The change in the PCE price index is known for capturing inflation (or deflation) across a wide range of consumer expenses and reflecting changes in consumer behavior.
The Consumer Confidence Index (CCI) is a survey, administered by The Conference Board, that measures how optimistic or pessimistic consumers are regarding their expected financial situation. A value above 100 signals a boost in the consumers’ confidence towards the future economic situation, as a consequence of which they are less prone to save, and more inclined to consume. The opposite applies to values under 100.
Certified Financial Planner Board of Standards Inc. owns the certification marks CFP®, CERTIFIED FINANCIAL PLANNER™, CFP® (with plaque design) and CFP® (with flame design) in the U.S., which it awards to individuals who successfully complete CFP Board's initial and ongoing certification requirements.
Links are being provided for information purposes only. Raymond James is not affiliated with and does not endorse, authorize or sponsor any of the listed websites or their respective sponsors. Raymond James is not responsible for the content of any website or the collection or use of information regarding any website's users and/or members.
GDP Price Index: A measure of inflation in the prices of goods and services produced in the United States. The gross domestic product price index includes the prices of U.S. goods and services exported to other countries. The prices that Americans pay for imports aren't part of this index.
The Conference Board Leading Economic Index: Intended to forecast future economic activity, it is calculated from the values of ten key variables.
The Conference Board Coincident Economic Index: An index published by the Conference Board that provides a broad-based measurement of current economic conditions.
The Conference Board lagging Economic Index: an index published monthly by the Conference Board, used to confirm and assess the direction of the economy's movements over recent months.
The U.S. Dollar Index is an index of the value of the United States dollar relative to a basket of foreign currencies, often referred to as a basket of U.S. trade partners' currencies. The Index goes up when the U.S. dollar gains "strength" when compared to other currencies.
The FHFA House Price Index (FHFA HPI®) is a comprehensive collection of public, freely available house price indexes that measure changes in single-family home values based on data from all 50 states and over 400 American cities that extend back to the mid-1970s.
Import Price Index: The import price index measure price changes in goods or services purchased from abroad by U.S. residents (imports) and sold to foreign buyers (exports). The indexes are updated once a month by the Bureau of Labor Statistics (BLS) International Price Program (IPP).
ISM New Orders Index: ISM New Order Index shows the number of new orders from customers of manufacturing firms reported by survey respondents compared to the previous month. ISM Employment Index: The ISM Manufacturing Employment Index is a component of the Manufacturing Purchasing Managers Index and reflects employment changes from industrial companies.
ISM Inventories Index: The ISM manufacturing index is a composite index that gives equal weighting to new orders, production, employment, supplier deliveries, and inventories.
ISM Production Index: The ISM manufacturing index or PMI measures the change in production levels across the U.S. economy from month to month.
ISM Services PMI Index: The Institute of Supply Management (ISM) Non-Manufacturing Purchasing Managers' Index (PMI) (also known as the ISM Services PMI) report on Business, a composite index is calculated as an indicator of the overall economic condition for the non-manufacturing sector.
Consumer Price Index (CPI) A consumer price index is a price index, the price of a weighted average market basket of consumer goods and services purchased by households. Changes in measured CPI track changes in prices over time.
Producer Price Index: A producer price index (PPI) is a price index that measures the average changes in prices received by domestic producers for their output.
Industrial production: Industrial production is a measure of output of the industrial sector of the economy. The industrial sector includes manufacturing, mining, and utilities. Although these sectors contribute only a small portion of gross domestic product, they are highly sensitive to interest rates and consumer demand.
The NAHB/Wells Fargo Housing Opportunity Index (HOI) for a given area is defined as the share of homes sold in that area that would have been affordable to a family earning the local median income, based on standard mortgage underwriting criteria.
The S&P CoreLogic Case-Shiller U.S. National Home Price NSA Index measures the change in the value of the U.S. residential housing market by tracking the purchase prices of single-family homes.
The S&P CoreLogic Case-Shiller 20-City Composite Home Price NSA Index seeks to measures the value of residential real estate in 20 major U.S. metropolitan.
Source: FactSet, data as of 7/7/2023